修行的女子最美丽

一、没有嫉妒心的女子,神态会恬静,脸如秋月般静美;

二、没有嗔恨心的女子,常有柔顺似水的品行,眼神会非常清纯而水灵;

三、常能轻言细语,不说粗话。且能常随喜赞叹别人的女子,可以吐气如兰,成就甜蜜动听之音声;

四、不邪淫之女子,可得高贵圣洁之相,气质优雅,楚楚动人;

五、不骄慢之女子,可成就朴实清纯之相,有山泉涓涓流淌之美感;

六、对万事万物心存爱心,常行布施的女子,因平等之爱心,而生出母爱般的光辉,成就神彩照人的慈和之美;

七、不贪婪、不抱怨之女子,因神气清净内敛,可得丰满圆润之体韵,并有柔弱无骨之美感;

八、做事专注、用心纯正,有具有以上诸德之女子,气注神凝,长久肌肤纯净如凝脂,神态恬美大方,静如皎月,动如波光熠动流淌,自然成就淑女诸种美德,形神魅力无可抵挡。

祝福天下女子福慧德相皆修成,全在一念心! 

Meeting with Eugene

Greatest takeaway: Always create value to others, not just people you are serving, but also people you are working. Once you ensure that there is sufficient value created, the others will take care of itself.

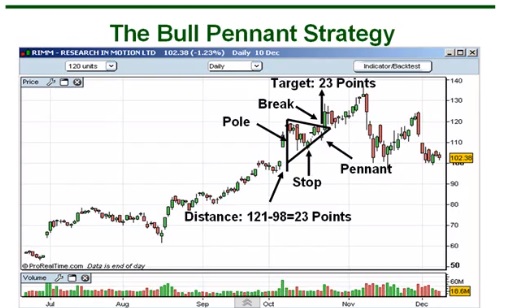
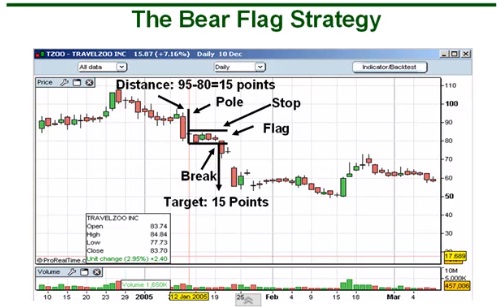
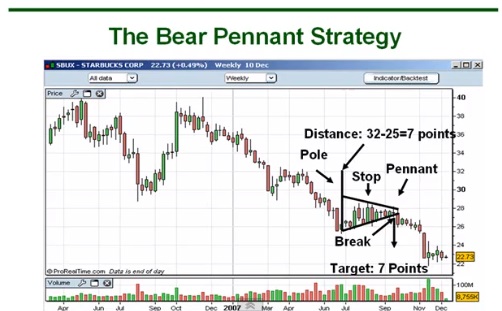
Flag and pennant pattern

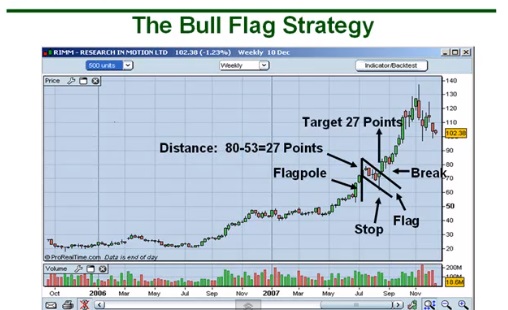
The flag and pennant pattern is used to spot continuation patterns. It informs traders if a downtrend is a reversal or just a correction.
Untitled

Untitled

The bull flag/pennant captures a downtrend in an uptrend.

Untitled

Untitled

The bear flag/pennant captures a downtrend in an uptrend.

Volume should diminish as the flag or pennant pattern mature, and volume should increase at the break.

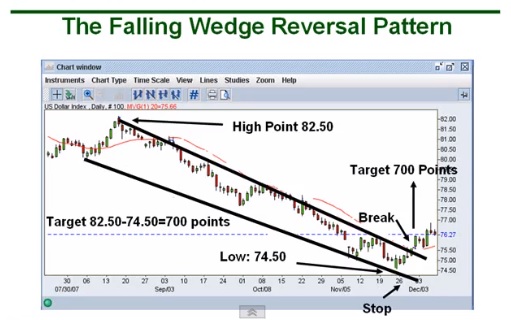
Wedge Chart Pattern

Untitled
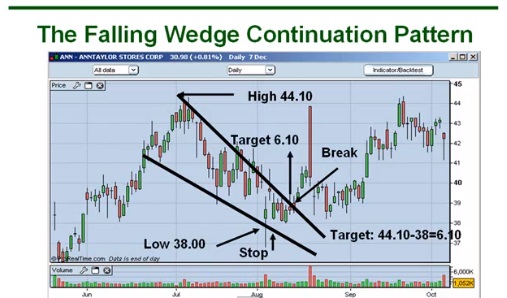
Market is in a downtrend and reverses into an uptrend.

Untitled
Market is in an uptrend and is undergoing a correction. After correction, market continues in an uptrend.

Note: Declining volume going into the break and rising volume on the break. Also, the duration the market took to complete the wedge serves as a good gauge as to how long the market will take to reach the target price.

Head and shoulders

– Stop loss placed on the right shoulder

– To further confirm the downtrend:

1. The neckline should be downward sloping

2. Volume running up to the head should be lower then volume running up the first shoulder, and volume running up the second shoulder should be lower than volume running up to the head

3. Volume should be large when price breaks the neckline

– Stop loss placed on the right shoulder

– To further confirm the trend:

1. The neckline should be upward sloping

2. Decreasing volume going into first shoulder, head and second shoulder

3. Increasing volume on the break of the neckline

Trading double top and double bottom

Double top (to short)

1. Take entry when price breaks below previous low

2. Volume in the run up to second peak should be weak, indicating that there are not too many buyers banging on pushing the price up again

3. Volume when price breaks below previous low should be strong, confirming that sellers are entering to push the trend down (ENTRY)

4. Place stop loss at second peak

5. Measure distance from previous low to second peak to get the target distance

6. Extrapolate this distance down from previous low (entry point) to get target price

Double bottom (to long)

1. Take entry when price breaks above previous high

2. Volume in the run down to second bottom should be weak, indicating weak interest in pushing price down

3. Volume when price breaks above previous high should be strong, confirming that buyers are in to ride the uptrend (ENTRY)

4. Place stop loss at second bottom

5. Measure distance from previous high to second bottom to get target distance

6. Extrapolate this distance up from previous high (entry point) to get target price

Interpreting Volume

Stock chart volume is the number of shares traded during a given time period.

Usually plotted as a histogram under a chart, volume represents the interest level in a stock. If a stock is trading on low volume, then there is not much interest in the stock. But, on the other hand, if a stock is trading on high volume, then there is a lot of interest in the stock.

Volume simply tells us the emotional excitement (or lack thereof) in a stock.

Liquidity

Stock chart volume also shows us the amount of liquidity in a stock. Liquidity just simply refers to how easily it is to get in and out of a stock.

If a stock is trading on low volume, then there aren’t many traders involved in the stock and it would be more difficult to find a trader to buy from or sell to. In this case, we would say that it is illiquid.

If a stock is trading on high volume, then there are many traders involved in the stock and it would be easier to find a trader to buy from or sell to. In this case, we would say that it is liquid.

Let’s look at a couple of common volume patterns on a stock chart:

volume on a stock chart

A surge in volume can often signify the end of a trend.

Here, on the left side of the chart, this stock begins to fall. Volume increases dramatically as more and more traders get nervous about the rapid decline of this stock. Eventually everyone piles in and the selling pressure ends. A reversal takes place.

Then, in the middle of the chart, volume begins to taper off (circled) as traders begin to lose interest in this stock. There are no more buyers to push the stock higher. A reversal takes place.

Then, on the right side of the chart, volume begins to increase again (second arrow) and another reversal takes place.

This chart is a good example of how the trend of a stock can reverse on high volume or low volume.

Mistakenly, some traders think that stocks that are “up on high volume” means that there were more buyers than sellers, or stocks that are “down on high volume” means that there are more sellers than buyers. Wrong! Regardless if it is a high volume day or a low volume day there is still a buyer for every seller.

You can’t buy something unless someone is selling it to you and you can’t sell something unless someone is buying it from you!

Dow Theory

Tenet 1: Market has 3 trends

Tenet 2: Trend has 3 phases

– Accumulation: When the experts start trading.

– Public participation: Public catches on what the experts are trading

– Excess: Where speculation kicks in. The experts will exit here.

Tenet 3: The market discounts all price

– Once news is released, it is already reflected in the price of the assets very quickly. So you can’t really fundamental analysis to beat the market.

Tenet 4: The averages must confirm each other

– The Dow Jones Transportation Average and the Dow Jones Industrial Average must be moving in the same trend to confirm the trend. If they are not, it is a signal of a impending reversal.

Tenet 5: Trends must be confirmed by volume

– Trend will be strong if it is accompanied by large volume, because it means there are lots of participants in this market. Even if price is still increasing, if volume starts to weaken, it means that participants are exiting this market and there might be an imminent trend reversal.

Tenet 6: Trends exist until definitive signals prove that they have ended


MACD Technical Analysis

MACD is a powerful indicator as it produces multiple signals whose confluence indicates strong confirmation of a change in trend. The advantage of MACD is that it is much more responsive than the MAs tracking price charts. MAs tracking price charts are lagging indicators while MACD gives a much earlier signal.

MACD is ideally used with Stochastic, CCI, and RSI.

Note: 9EMA = trigger line = signal

How MACD Works?

–          MACD (Also known as Centering Oscillator)

  • Difference between the value of 12EMA and 26EMA
  • Value of 12EMA – Value of 26EMA

Signal 1: Histogram

–          Histogram shows the gap between MACD and signal

  • Positive when MACD is above signal
  • Negative when MACD is below signal

–          Histogram is an indicator of the indicator

  • If histogram bars start to weaken and converge to the zero line from below, it indicates that MACD is close to crossing above signal
  • If histogram bars start to weaken and converge to the zero line from above, it indicates that MACD is close to crossing below signal

Signal 2: Price and MACD convergence/divergence

–          Convergence and divergence

  • On an uptrend, price charts can be achieving higher highs, but the corresponding MACD may be achieving lower highs
  • On a downtrend, price charts can be achieving lower lows, but the corresponding MACD may be achieving higher lows
  • These indicate that a trend change may be imminent despite price movement seem to show otherwise

–          Divergence with price is the least frequent but the most powerful

  • To go long, MACD must be achieving higher lows
  • To go short, MACD must be achieving lower highs

Signal 3: MACD/centerline crossover

–          MACD crossing of the zero line signals crossover of 12MA and 26MA

  • MACD crosses above the zero line, 12EMA above 26EMA, bullish
  • MACS crosses below the zero line, 12EMA below 26EMA, bearish

–          MACD centerline crossovers are slightly more reliable

  • Enter when MACD crosses the zero (indicates bullish signal)
  • Exit when MACD crosses the zero line (indicates bearish signal)

Signal 4: MACD/signal crossover

–          MACD/signal crossovers are the most unreliable

  • Enter when MACD cross above the signal/trigger line
  • Exit when MACD cross below the signal/trigger

Signal 3 and 4 are very frequent and not very reliable. They should be taken more as a confirmation for signals indicated by 1 and 2 rather than taken as instructive signals themselves.

London dishes up hot dogs with champagne

When Sandia Chang lived in New York a few years ago, she had a favorite way of dining with her friends.

“We used to collect great wines; we were sort of wine geeks. We’d always get together and go somewhere where you could bring your own wine. So we’d always end up at some Chinese food place in Chinatown, a pizzeria in Brooklyn or some brassiere down in the East Village.”

Being a self-proclaimed “wine geek,” Chang’s usual fare of spaghetti bolognese was rarely accompanied with cheap vino. Instead, she would enjoy a bottle of Sassicaia, usually sold for $800 in fine restaurants.

“It was always simple food, but we’d always crack open a great wine with it. That drastic difference in things makes it fun and cool,” Chang says.

It was this chasm between the casual and classy that encouraged Chang to open Bubbledogs in London last year: a 40-seat bar/restaurant that serves gourmet hot dogs with a selection of grower champagnes and sparkling wines.

It is certainly a niche market in London – a city fast-becoming a capital obsessed with high-end fast-food.

New York popcorn shop “Populence” founder Maggie Paulus, created wine infused popcorn. The popcorn is available in New York City’s West Village location.

U.S. fine burger chains Shake Shack and Five Guys opened their first U.K. stores earlier this month, in the hopes of taking on U.K. restaurants like Meat Liquor, Honest Burger and Byron, which all cater to a growing crowd of Londoners who prefer to fork out a bit more cash for a decent burger and bun.

Chang – whose hot dogs cost between £6 and £7.50 ($9 and $11.25) – said good value is the key. After all, the champagne to wash down that gourmet hot dog starts at £6 ($9) per glass.

“I think people are very conscious of their money. They want something for value,” she told CNBC. “They could pay £3 for a dirty hot dog down the street on a cart, but they know in their head that it’s not great quality. It’s a balance. If you had £7, what would you get? You’d make sure what you got was quality.”

John Eckbert, the director of operations for Five Guys U.K., said it was the selection of their ingredients that set them apart. “What Five Guys wants to say is: if you’re having your mom over for dinner and you were cooking burgers, how would you do it? You’d pick the best meat, the best buns, buy the best tomatoes and lettuce, and carefully prepare them. That’s a really different mindset from McDonald’s.”

Both Bubbledogs and Five Guys spent a long time sourcing their meats and buns from England to ensure they got their specialities just right.

“All these places,especially single-item or single-concept places, you know that if they are only selling one thing, it’s probably the best they do,” Chang says.

bubbledogs
Sandia Chang, founder of bubbledogs

Different Approaches

But despite a number of similarities, Five Guys and Bubbledogs have markedly different approaches when it comes to the future of the business.

Five Guys currently has 1,200 restaurants in the U.S., with another 200 expected by the end of the year. In the U.K., they plan to open new stores in Angel in North London and Westfield shopping center in West London, as well as one in Reading.

Eckbert says that in its first week, Five Guys’ first U.K. restaurant was churning out about 1,500 burgers a day and that “the store has broken records for first-week sales for a Five Guys by meaningful margins.”

Bubbledogs on the other hand, isn’t going anywhere. It focuses on grower champagnes (champagnes produced by the same estate that owns the vineyard from which the grapes come), so there is a small pool from which Chang chooses the bottles available in the restaurant.

She says that some only produce around 8,000 bottles a year, which means they can run out and she struggles to get any more.

The champagne is key for Chang because that’s where her passion lies.

“Our sales are 50-50: 50 wet and 50 dry,” she says. “And at the moment people do come here because of the hot dogs, which is what I wanted because if it wasn’t for the hot dogs they wouldn’t come in and try the champagnes.

“I’m hoping in the future people will realize our champagne list and will come for the champagne equally as they come for the hot dogs.”